Data
INFO 3402: Multi-Dataset Dashboards
Class project for INFO 3402 where I sourced three independent datasets and transformed them into interactive, insightful dashboards. Each dashboard explores a unique domain—personal wellness correlations, sports analytics, and music streaming patterns—applying consistent visualization principles and data storytelling.
Screenshots
Role
Data Analyst
Timeframe
2026
Highlights
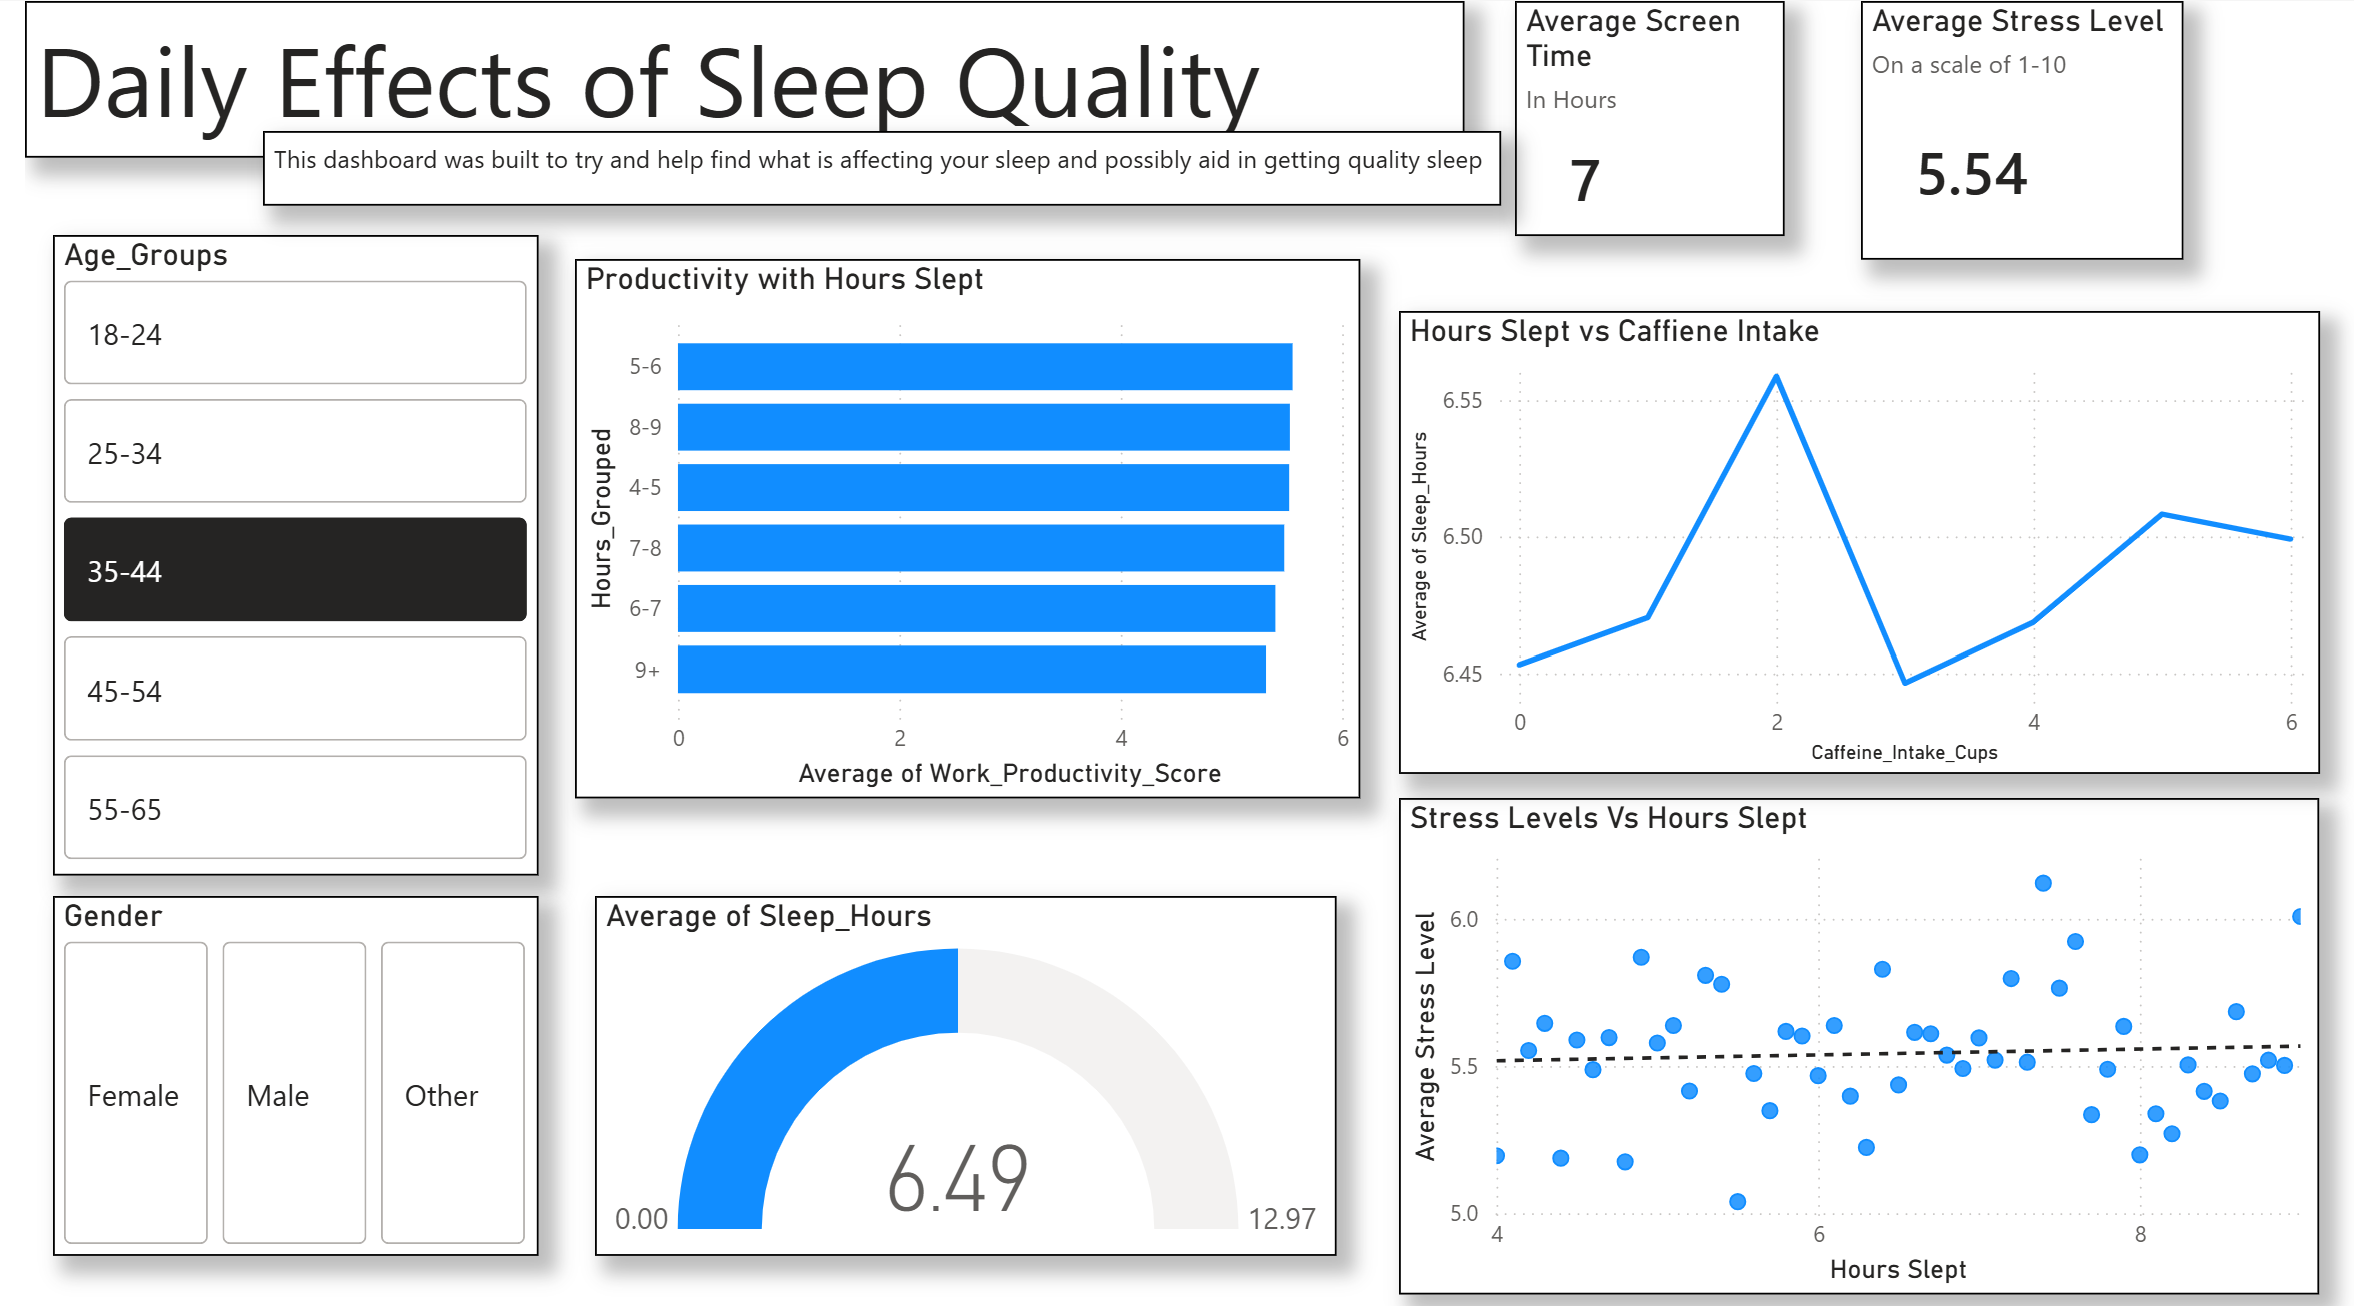
- Sleep vs Screen Time: Analyzed personal wellness data to explore correlations between screen time and sleep quality/duration.
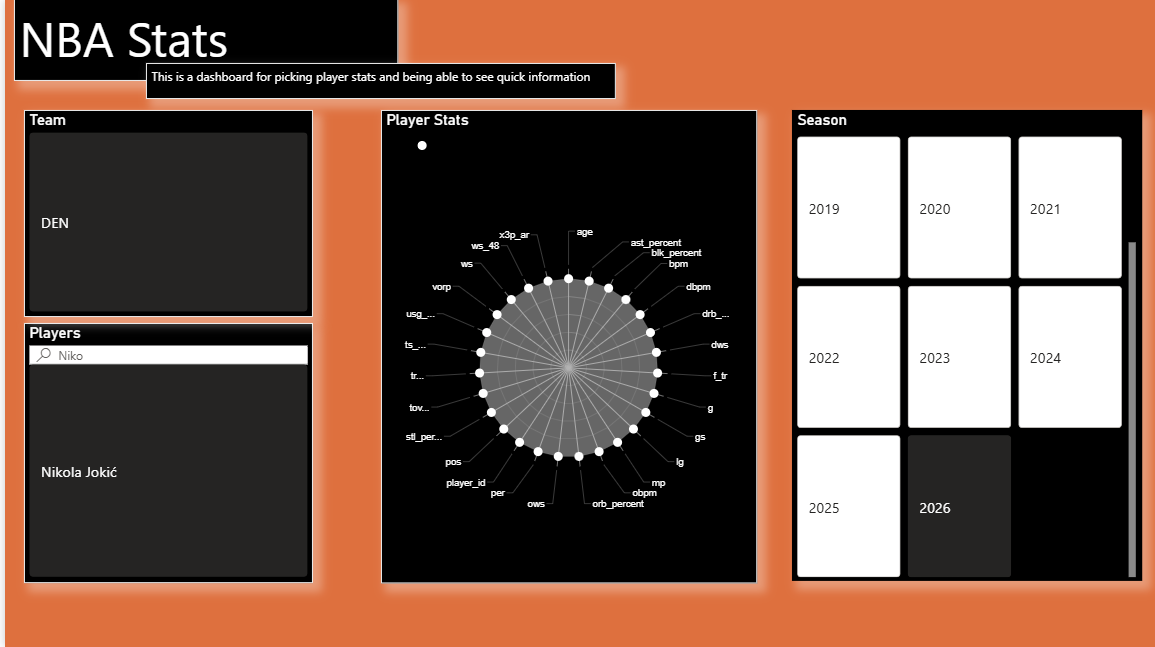
- NBA Statistics: Built interactive dashboards to compare player performance metrics, team standings, and historical trends.
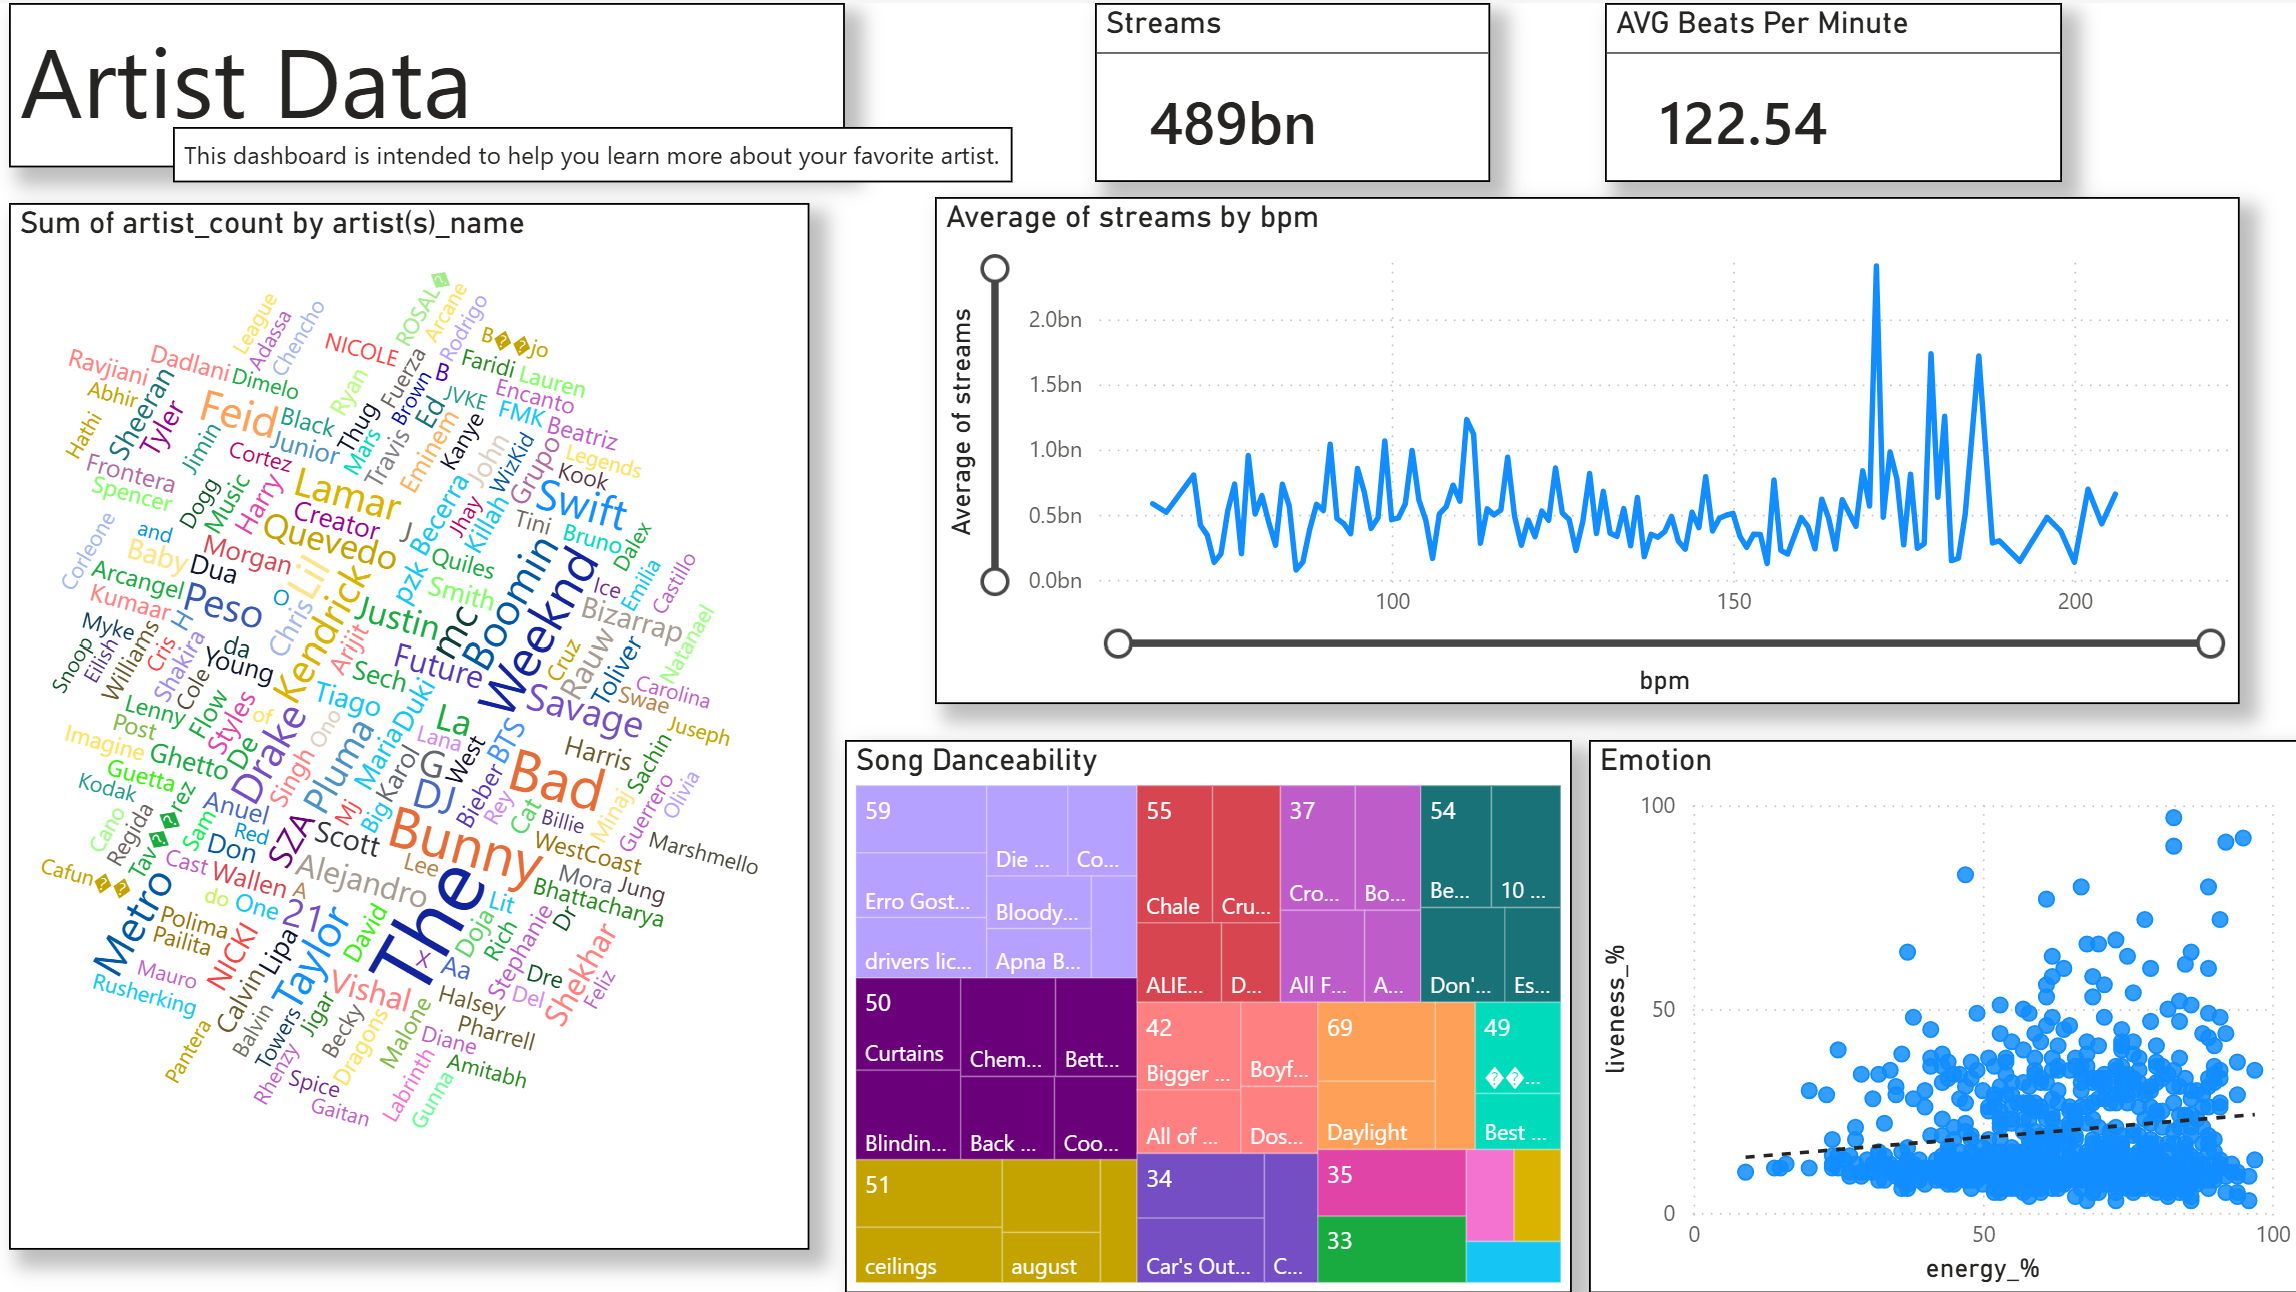
- Spotify Data: Created visualizations of music listening patterns, genre trends, and artist analytics.
- Applied consistent dashboard design patterns across all three projects for clarity and usability.
Tech Stack
Power BIExcelData VisualizationData CleaningAnalytics